
Municipal-Level Results: Safety Monitor 2025
In the fall of 2025, 1,566 residents of our municipality completed the national Safety Monitor survey. In this survey, we asked for their opinions on the quality of life and safety in our municipality.
Sense of security
We asked participants how safe they feel in our municipality and how much they enjoy living here. This includes, for example, interactions between residents, community involvement, participation in society, local amenities, the quality of public spaces, and various forms of nuisance and pollution. We also asked whether residents had been victims of crime and what measures they take to prevent it. We also wanted to know what residents think of the municipality and the police. This information has been supplemented with objective figures and other data. This gives us insight not only into how safe residents feel, but also into how safe the municipality actually is. We call this subjective safety.
Citywide results
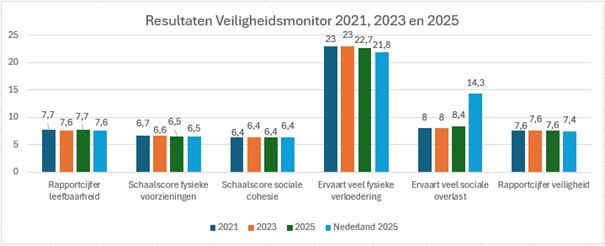
In conclusion, we can say that the results at the municipal level do not differ significantly from those of the previous survey in 2023. Our residents’ perceptions of quality of life and safety appear to have remained consistent in recent years.
Livability
How pleasant and enjoyable your living environment is depends in part on what the neighborhood looks like and how the residents interact with one another. We asked residents to rate the quality of life in their neighborhood.
Amenities are important for the quality of life in a neighborhood. These include the design of public spaces, sufficient playgrounds, street lighting, green spaces, and activities or places for young people. Social connections are also important for community cohesion. This involves meeting places, interaction among residents, a sense of community, and issues such as loneliness.
A higher score on social cohesion indicates that residents have a more positive view of the sense of community and cohesion in their neighborhood.
Nuisance in the neighborhood
The maintenance of public spaces is also important for the residential and living environment. This is measured using a score that indicates the extent to which residents perceive physical deterioration, such as litter, broken facilities, or poor maintenance. In addition, social disturbances are taken into account, such as those caused by young people, noise pollution, or individuals exhibiting disruptive behavior. A score is also used for this purpose to indicate the level of social disturbance experienced by residents.
Safety
How safe you feel is partly determined by your past experiences and whether, for example, you have been a victim of crime. We asked residents to rate how safe they feel, both in general and in their own neighborhood.
It turns out that 2% of residents in our municipality often feel unsafe in general, compared to 2.5% nationwide, and that 1.5% often feel unsafe in their own neighborhood, compared to 2.5% nationwide. On the other hand, our residents are less likely to be victims of crime than the national average in the Netherlands. For example, in the past year, 16.6% of residents were victims of cybercrime, compared to 16.8% nationwide. Additionally, 18.5% of our residents were victims of traditional crime, such as home burglary or bicycle theft. The national average is 20%. Furthermore, 6.5% of our residents were victims of violence, compared to 6.7% nationwide.
Continued
A great deal of information can already be gleaned from the results above. We are also receiving data at the neighborhood level. We are working hard on an infographic to visualize this information, and we will let you know as soon as it is available. After that, the various teams within the municipality will continue to work with internal and external partners and residents to further improve the living environment in the neighborhoods!