View climate stress test results
Using the viewer
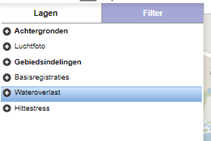
Go to the viewer. Then in the left column of the 'Layers' tab, click on the plus sign for the component you want to see. Once you have clicked on this, you will see different view options of that component.
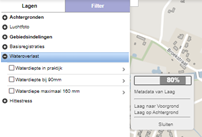
Put a check mark in one of the boxes. On the right side of the line, click the ">" symbol and slide the dark bar that then appears to the right or left to change the color intensity on the Map .
The search field at the top of the bar allows you to search by address or zip code. You can also zoom in and out with the magnifiers, or by scrolling the mouse wheel.
PDF of Map
Depending on the speed of your Internet connection, it may take a few seconds hours for the Map to fully load.
The viewer has no direct print functionality. However, you can create a pdf of a self-selected area on the Map and then print it. The pdf function can be found at the top right of the screen.
Is the viewer up to date?
In preparing the map material, the Basic Address and Building Records (BAG) was used for the buildings. The situation in the BAG has been updated until spring 2021. In addition, General Height Map of the Netherlands 3 (AHN3) was used to calculate water flows. The AHN3 was finalized in 2017. Since that time, several activities have taken place in our municipality, such as building houses, constructing infrastructure or other objects in public spaces. As a result, the situation on the Map in the viewer may differ from the current situation in some places. The results shown on the Map should then be interpreted with some caution. This is for example the case in Luchen phase 2 (Vlinderlaan and surroundings) and in the plan Kasteeltuinen (Tureluur and surroundings).